
Uncertainty in measurements made with the Chronometric Micrometer
Introduction
When measuring double stars, the common amateur observer appeals to a visual and completely economic instrument: the classic and useful "Chronometric Micrometer" (see bibliography for further information). Every observer has a different timing when pressing the button of the chronometer and can obtain false information if he doesn't bear in mind possible errors produced by the micrometer. Then we should ask ourselves: how precise this method is?
This article seek to offer the observer the basic tools to be able to calculate the error of the angular separation obtained with the chronometric micrometer.
Measurements and Uncertainty
While observing a physical phenomenon or an object, we use the measurement process to determine the magnitude of this phenomenon or object; for example, if we want to measure the Angular Separation AS of a binary star, we can use a filar micrometer to calculate the amount of times a unit of measurement enters in the distance between the two stars, in this case the unit of measurement is the arc second (").
All observational magnitude should be expressed in the following way:
Magnitude = (measured magnitude ± uncertainty) measured unit
where:
measured magnitude: is the numeric value obtained with the measurement instrument.
uncertainty: commonly called "measurement's error", expresses the symmetrical interval, with center in the measured magnitude, as the most probable place where this magnitude is.
measured unit: is the unit of measurement used to express the magnitude of the phenomenon obtained with the measurement instrument (°, sec,", cm3, kg, etc).
Example: AS = (3.00 ± 0.13)", also, AS = 3.00" ± 0.13", mean the most probable value of the AS is in the interval (3.00-0.13, 3.00+0.13)", or (2.87,3.13)".
The resolution of a graduated scale is the smallest discernible interval in that scale, that is to say the smallest distance between two successive divisions.
In a direct reading scale instrument(continuous scale), like a ruler, a protractor, or an analogical chronometer (with needles), the instrumental uncertainty or "instrumental error" denominated "ie", can be defined as: ie = resolution / 2
Ex: if our ruler has intervals of 1 mm, its resolution is of 1 mm, then the instrumental uncertainty "ie" is of 0.5 mm; if our protractor has intervals of 1°, its resolution is of 1°, then the instrumental uncertainty is 0.5°.
In instruments with indirect reading scales(discreet scales), as a digital chronometer, the instrumental uncertainty should be defined as:
ie = resolution
Ex: if our chronometer shows in its screen a time up to hundredths of second, its resolution is of 0.01 sec, then the instrumental uncertainty is of 0.01 sec. But this general rule should be applied carefully, because every observer often introduces imprecision to the sensibility of the apparatus. In such cases there is no general strategy to search for errors, and the observer should make reasonable estimations of the error he's made: when time is measured with a chronometer with a resolution of 0.01 seconds, the main limitation is not the apparatus precision, but the synchronization errors made by the observer when he presses the button, which are estimated in not less than 0.2 – 0.3 seconds. This is the error that should be applied to this type of measurements.
The "internal error" depends on the group of measurements, and it's given by the formulas that are detailed below in this article; the "external error" is the difference between our measurements and the data obtained in an accurate professional catalogue.
Accuracy and precision
Let us remember that the accuracy of a measurement describes how near a measured value is regarding the true value, and the precision of a group of measurements describes how dispersed the measured values are regarding themselves.
Direct measures
When we measure the Position Angle PA with the protractor, or we measure the time taken by two components of a binary system in crossing the same filament of the reticle of the eyepiece by using a chronometer, it is said that we are carrying out a direct measurement of this magnitude.
Significant figures
When we give a magnitude and it's error, we should bear in mind the significant figures, that are related to the uncertainty. For example, if we use a protractor with a resolution of 1°, we can't say that the PA of a binary system is 215.166712648° because in the measurement process we are using a protractor that is only allowing us to read integer numbers. Therefore we will round the number, discarding the last figures to 215.0°, and so we say that this angle has 4 significant figures. It is very important that the observer do not "estimate" decimals that aren't shown by the protractor, because he tend to invent figures when trying to obtain a precise measurement. The measured magnitude must be expressed with the same amount of significant figures than the uncertainty; then, it would be incorrect to write (215.166712648 ± 0.5)° , (215.2 ± 0.53791)° or (215.2 ± 0.5)°.
The correct way to write it is: (215.0 ± 0.5)°.
Universe of measures
If we analyze an infinite group of measurements (impossible to be carried out in practice) we are analyzing the "universe" or "population" of those measurements, when we study a finite group of those measurements we are studying a "sample".
Assuming that the uncertainties are independent from each other, that the measures are independent from each other, and that there are many measures, then the mathematical theory that satisfies these conditions is the Distribution of Gauss or Normal Distribution and it gives us the probability that a measure is found inside in an interval.
To calculate the uncertainty
Given a group of N measurements {x1,x2,x3,..., xN}. xi is the measured number "i", and N the total amount of measurements, it is deduced:
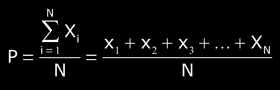
P is the "average", the most probable value, the nearest value to the true value.
It is defined:
ei = P - Xi , the "error of each measurement regarding P".
The "standard deviation" σ (or "mean quadratic error") is related to the lack of precision of the group of samples, as σ increases, the precision of the group of measures decreases:
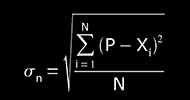 "standard deviation" (if N >> 30)
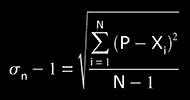 "standard deviation" (if N << 30)
Also, σ gives a measure of the intrinsic precision of the apparatus.
We will choose one of the formulas of the deviation, depending of the amount of measurements. If we have more than 30 measurements, (N>>30, σ=σn); if we have less than 30 measurements,(N<<30, σ=σn-1).
Consequently we deduced:
 "error or relative deviation of each measurement"
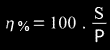
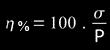 "percentage of error of each measurement"
The relative deviation η is useful to compare measurements taken in different sessions. As it is not dimensional, it should not be expressed with unit of measurement (°,",etc.).
Now we have: Magnitude X = P ± σ
It also defines the "variance" ν:
ν = σ2
then
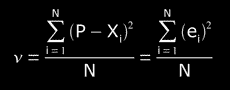 (if N >> 30)
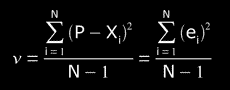 (if N << 30)
But if we carry out several series of measurements we will obtain for each one of them, their respective average, and we will obtain a new normal distribution of the averages.
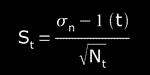
Then, S is the "standard deviation of the average" also called "standard error", this standard deviation of the distribution of averages it give us the uncertainty of the average value:
 , where σ can be σn or σn-1 (our case).
Evidently, S is always smaller than σ.
In all Gaussian distribution, there is a probability of 68.3% that the average value of the universe is in the interval (P-S, P+S), a probability of 95.4% that it is in the interval (P - 2S, P + 2S), and a probability of 99.7% that it is in the interval (P - 3S, P +3S).
Finally, the result of a series of measurements is indicated this way: (P ± 3S) unit that is to say, "the most probable value in the measured magnitude is P", or "the probability that the true value is in the interval (P - 3S,P + 3S) is of 99.7%."
Also we have:
 "error or relative deviation of the average"
 "percentage of error of the average"
To discard Measurements
For direct measurements we can make a statistical analysis only if we have many measurements, but time, weather and other factors may limit the amount of them we can obtain in one night. In fact, there is no point in making a statistical analysis with less than 10 measurements, because in an estimation of σ, the intervals of probabilities of 68% or of 95% become very big in comparison with the central value of the distribution. Then, we will be establish ten (10) the minimum number of amount of measurement.
The procedure consists in:
- taking a group of measurements, slightly superior to the minimum; around fifteen is within possible parameters, but it can take more measurements if conditions allow it.
- calculating the average P and the standard deviations σ of each measurement.
- rejecting all those measures xi that are outside the interval [P – 3σ, P + 3σ].
This procedure is repeated until all the measurements are inside the defined interval, or until the amount of registered measurements is greater or similar than ten (10).
- after doing this, we must choose a formula:
- when the amount of measurements it have is grater or similar to ten (N≥10), S is established by using
and the result is expressed as: P ± 3S; if 3S is less than the instrumental error, then the instrumental error will be the uncertainty of the measure magnitude.
- if the amount of measurements is smaller than ten (N<10), we take the following value as uncertainty of the measured magnitude:
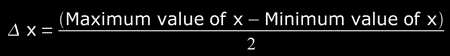
and the result is expressed as: P ± Δx;
- if N = 1, the uncertainty is the instrumental error "ie", and the result is expressed as: P ± ie.
Indirect measures and Propagation of errors
When magnitude f is a function of other measured magnitudes x,y,z,..., that is to say f=f(x,y,z,...), it is said that f is measured indirectly.
Given x,y,z,... independent measured magnitudes with respective standard deviation σx, σy, σz, ... (similarly standard error Sx,Sy,Sz,…) and Nx,Ny,Nz,… are the number of measurements of x,y,z,… respectively.
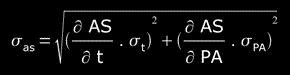
If the errors in x,y,z,... are uncorrelated (i.e., the errors are independent of each other) and if the errors are at random, using the first order term of the Taylor's expression for a function of several variables we obtain:
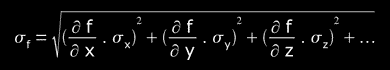
σf is the "standard deviation of f", and
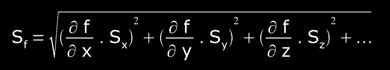
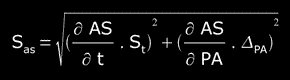
Sf is the "standard error of f", given the expression:

the partial derivative of the function f(x,y,z,...) with respect to x (evaluated at the average value Px); the partial derivative of f(x,y,z,...) with respect to the other variables y,z,… must be calculated similarly, and will be evaluated with the average values Py,Pz,... respectively.
If angles appear in the formula, these angles and their errors should be expressed in radians, the natural unit for angles. This should be applied for the PA and the other angles.
The numeric constants, and the magnitudes that are known to be accurate, will be constant in the derivation process.
With the average of each variable Px, Py, Pz,..., we can write finally:
f = f(Px,Py,Pz,...) ± 3Sf
On the other hand, when the amount of measurements of each variable is smaller than 10, we cannot apply the statistical treatment to obtain the uncertainty, so we simply use the total differential, obtained by means of the differential calculation, whose result will express the
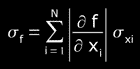
standard deviation of our measurement,
![]()
being the absolute value of the partial derivative.
In general, if "a" is a real number:
|a| = -a if a < 0
|a| = a if a > 0
that is to say, if a number is negative it becomes positive, but if it is positive it remains equal.
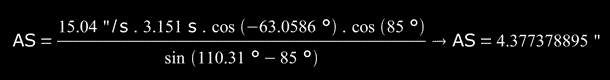
In case we want to obtain the Angular Separation AS of a binary system, by means of the chronometric micrometer, we should use the following equation:
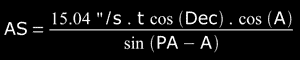
Of course, this function is defined necessarily for PA ≠ A, since what we are looking for is in fact that the two stars of the binary system take a certain time t ≠ 0 in crossing the filament of the reticle, and this equation is only used when PA ≠ 90° or PA ≠ 270°. How would the equation of AS be if PA = 90° or PA = 270° ? , a data: A=0° (see bibliography, DSO #19 and DSO #30).
Notice that AS is a function that depends on two variables, t and PA, that is to say that depends on the timed times and on the PA measured, and considering the angle "A" as a constant without uncertainty (we have only measured it once, and this measurement will be constant in our calculations). Then, AS=AS(t,PA).
For those readers that don't possess elementary knowledge of Mathematical Analysis, it give the partial derivatives of the function AS(t,PA):
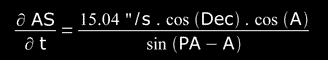
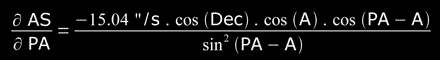
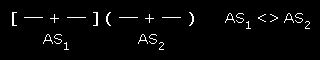
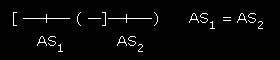
Two similar measurements
Given AS1=AS1±S1 and AS2=AS2±S2, we say that AS1 and AS2 are similar only if |AS1 - AS2| ≤ S1+S2 . Graphically:
Example:
In March 7th 1992, at 6.008333 hs UT, I measured the binary system Dun 252 AB (Alpha Crucis AB), located at RA= 12h 26.6m (2000.0) Dec= -63°06' and with proper motions Dar=-036"/millennium y Ddec=-012"/millennium (W.D.S.).
I got the following measurements:
Position Angles "PA": 110.50° , 111.00° , 108.50° , 109.00°, 111.50° , 111.50° , 109.50° , 111.00°.
Angle "A" = 85°.
Timed times "t": 3.67 s, 2.61 s, 3.07 s, 3.07 s, 3.21 s, 4.42 s, 3.06 s, 2.22 s, 3.30 s, 2.95 s, 3.08 s.
Resolution's protractor: 00°30´ (error in PA: 00°15´=0.25°)
Resolution's watch: 0.01 sec (error in t: 0.01 sec)
Then, we start the calculations:
AR=12:26:13.27 (1992-March-7-6.0083) DEC=-63:03:30.96
PA) NPA=8 ( NPA<<30 , direct measure )
PPA: (average)
PA1=110.50 , PA2=111.00 , PA3=108.50 , PA4=109.00
PA5=111.50 , PA6=111.50 , PA7=109.50 , PA8=111.00
=> sum = 882.50
and we do
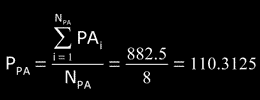
-> PPA=110.3125°
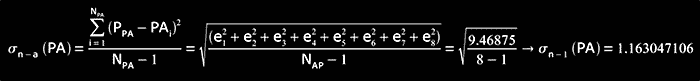
σn-1(PA): (standard deviation)
ei = (PPA-PAi) (ei)2 = (PPA-PAi)2
e1  -0.1875    0.03515625
e2  -0.6875    0.47265625
e3  +1.8125    3.28515625
e4  +1.3125    1.72265625
e5  -1.1875    1.41015625
e6  -1.1875    1.41015625
e7  +0.8125    0.66015625
e8  -0.6875    0.47265625
      => sum = 9.46875
and we do
![]()
and we calculate I3σn-1 (PA) as:
I3σn-1 (PA) = (P-3σn-1, P+3σn-1) = (106.82°, 113.80°)
the procedure is the following:
because all angles PAi are inside interval I3σn-1(PA)
-> no measured angles "PA" are rejected => NPA = 8
-> but NPA < 10, then:
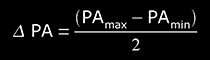
so
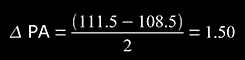
and final result will be in form: PA = PPA ± ΔPA
-> PA = (110.31 ± 1.50)°
t) Nt = 11 ( Nt << 30 , direct measure )
We use the same procedure used for PA:
Pt = 3.150909091 sec (average)
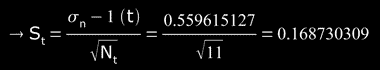
σn-1(t) = 0.559615127 (standard deviation)
3.σn-1(t) = 1.678845383, and we calculate I3σn-1 (t) as:
I3σn-1(t) = (P-3.σn-1 ,P+3.σn-1 ) = (1.472 sec,4.830 sec),
the procedure is the following:
because all timed times ti are inside interval I3σn-1(t)
-> no timed time "t" are rejected => Nt = 11
-> but Nt ≥ 10, then
 (standard error)
and final result will be in form: t = Pt ± 3St
Propagation
In this particular case, we are trying to combine two parameters that have different distribution curves:
- "t" : distribution of Gauss, t = Pt ± St
- "PA": rectangle limited by the values PA+ ΔPA and PA - ΔPA.
As we use Pt then the average of the universe of t has a probability of 0.683 of being in Pt ± St .
Then we look for the limits of PA that have the same probability of 0.683 of containing the real value, then
PA = PPA ± 0.683 * ΔPA.
Now, we establish the average value for AS:
On the other hand, ΔPA = 1.5° ≅ 0.026179938 rad,
but ΔPA = 0.683 * ΔPA, then ΔPA = 0.017880897 rad
And
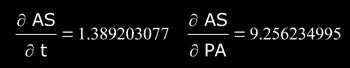
so, the σn-1AS "standard deviation of AS" is:
and the SAS "standard error of AS" is:
so,

then SAS = 0.286944528", and doing 3*SAS = 0.860833584" ( for 99.7% )
-> AS = (4.38±0.86)"
There is the final report of the measurement:
** Star: Dun 252 AB = Alpha Crucis AB
   Coordinates: 12:26.6(2000.0)-63:06
   Information:  1.3:1.8  B1V
   Last Measurement:  1994  112° 4.0"
   Observer: Alejandro Eduardo Russo
   Date & Time: March  7th, 1992,  6.0083 hs UT
   Location of site: Buenos Aires, Argentina.
   LAT -34:36:18.9 LONG W58:26:04.5
   Seeing: 9 <1-10 Seeing Scale (10 Best)>
   Sky Darkness: 5m <limiting magnitude>
   Telescope: refractor Zeiss 6.30"  f/15.44  205.83x
   Eyepieces: Kellner 12 mm with reticle double filament
   Method: chronometric micrometer
   Measure:  1992.183743169
   PA = (110.31 ± 1.50)°
   σn-1(PA)=1.163047106 °, NPA=8
   AS = (4.38 ± 0.86)"
   σn-1(AS)=0.799802422", NAS=11 (propagation)
Bibliography
- "Experimentation: an introduction to measurement theory and experiment design", by D. C. Baird, Spanish American Prentice-Hall, second edition, 1991.
- "An Introduction to error analysis", by J. R. Taylor, University Science Books (QUP).
- "Experimental Measurements, Precision, Error and Truth", by N.C. Barford .
- "Introduction in the Theory of Errors", by Déniz Sanchéz, A. González Santana, Miguel J., ULPGC
- "Elementary Mechanics", by Juan G. Roederer, Eudeba, 1975.
- "Differential and Integral calculation", by N. Piskunov, Uteha, 1991
- "The Double Star Observer's Handbook", by Ronald C. Tanguay, 1998
- "Measurements of Double Stars using the Chronometric Micrometer", by William T. Geertsen, DOS Issue #19
- "Measurements of Double Stars using the Transit Method", by William T. Geertsen, DOS Issue #24
- "A New Visual Method of Measuring Binary Stars for the Amateur Astronomer", by Alejandro Eduardo Russo, DSO Issue #30
- "Deductions of the Equations for the Chronometric Micrometer and the Angular Micrometer", by Alejandro Eduardo Russo, DSO Issue #34
- "Astronomical Algorithms", by Jean Meeus, SE, Willmann-Bell, Inc., 2000
- Gratefulness: thank you to Miss Eva María Ferrari for help me to translate this article (note from the author), and thank you to Mr. Ronald C. Tanguay for his unconditional help.
- Binary Stars's page: web site about binary stars (in english and spanish) and from which you can download freely the software EFEBIN ("Ephemeris of Binaries").